Data Overview
RIECE Panel Data (RPD) is an annual panel data from a rural area of Thailand. The survey started in June 2016, targeting children one to four years old in Mahasarakham and Kalasin provinces, where the RIECE Thailand project started. Therefore, we call the data “RIECE Panel Data (RPD).”
Structure of the Questionnaire
The questionnaire (QN) comprises four main parts: household QN, children information QN, child development QN, and school QN.
1. Household QN was adapted from the Annual Townsend Thai Data Survey and Thailand Socio-Economic Survey (SES), which collected detailed information about each individual in the household, e.g., jobs, education, age, gender, labor income, occupations, etc., and household information, e.g., household assets, expenditures, etc. In addition, this survey asked about time spent on working, sleeping, and other forms of leisure and the health problems of each household member. Further, we will elicit caregivers’ risk, time, and social preferences.
2. Children information QN asked for information about the child’s foods and milk, breastfeeding, child-rearing time, father involvement, information acquisition, and time adults in the household spent with the child (e.g., reading, singing, playing, holding, etc.). This part of the QN was adapted from several sources, including the Cohort Study of Thai Children, the World Health Organization Quality of Life, the National Educational Panel Study, and the Early Childhood Longitudinal Program. Like the pregnant conditions, we extracted information about the child’s vaccinations, health checkups, and delivery conditions (gestation duration, birth weight, body length at birth) from the mother-child booklet (recorded by health care providers).
3. Child development QN interviewed primary caregivers regarding Gross Motor, Fine Motor, Receptive Language, Expressive Language, and Personal and Social (based on DSPM developed by the Ministry of Public Health of Thailand). In the later year, each child is assessed regularly using standard instruments, e.g., DENVER II, Wechsler Intelligence Scale for Children (WISC), etc. Moreover, we will similarly elicit children’s risk, time, and social preferences to the caregivers.
4. School QN collected basic information from school directors and teachers. This part of the QN will start once the children are in childcare centers. This QN may include classroom observations if the budget permits.
Sampling Framework
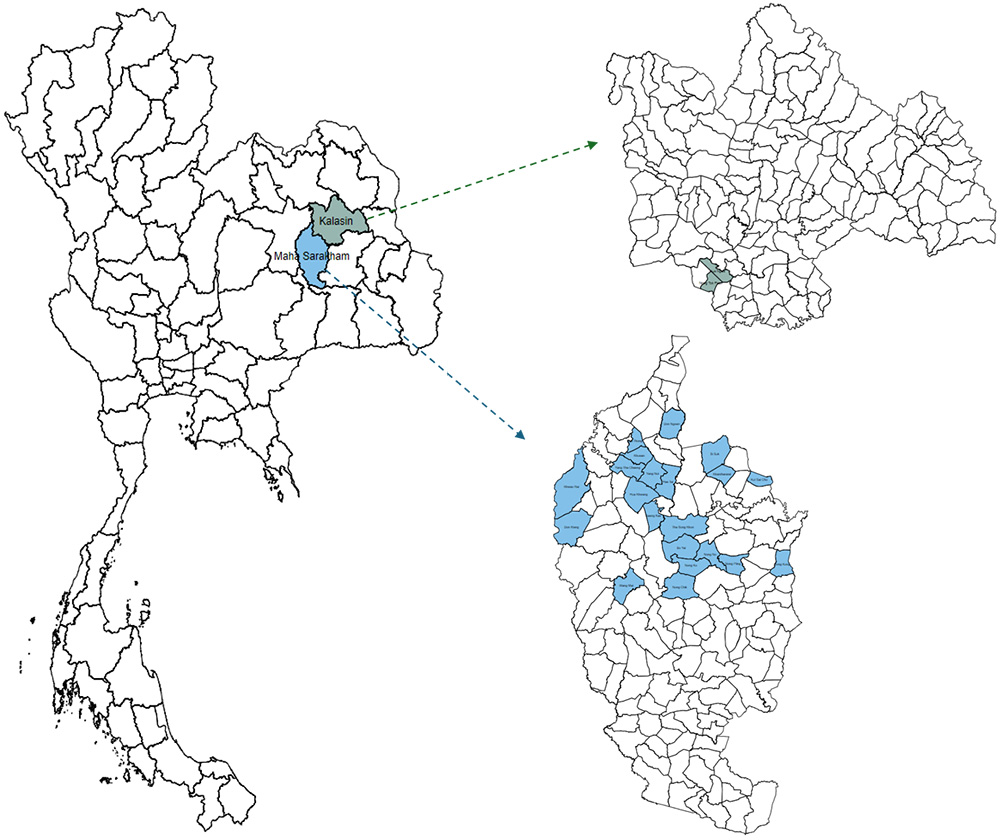
The survey covers 23 Subdistricts or Tambons of Mahasarakham and Kalasin provinces, where the RIECE Thailand project started. Therefore, we call the data “RIECE Panel Data (RPD).” Note that Tambon is the smallest official local governmental organization in Thailand. Each Tambon in the survey area consists of 8 to 24 villages. We began the sampling by asking village health volunteers who lived within the villages to conduct the census to collect data on the number of eligible children in each village.
Each village was categorized into three groups based on the number of eligible children relative to other villages in the same Tambon.
1) Small villages: villages whose number of eligible children was less than the 30th percentile.
2) Medium villages: villages whose number of eligible children was between the 30th-70th percentile.
3) Large villages: villages whose number of eligible children was larger than the 70th percentile.
One small, two medium, and one large village were randomly chosen from each Tambon, for a total of 92 villages. Two more small villages were selected from two Tambons, for a total of 94 villages, because the original small villages from these two Tambons had less than three eligible children. We targeted all one-to-four-year-old children in the chosen villages. However, some primary caregivers refused or were unavailable for an interview during the survey period. We also included children aged five who lived in the same household as the targeted children, and their primary caregivers were available for interview (41 children). The survey mistakenly included 21 newborns as well. The total number of samples from this group was 1,040 children from 886 households in 94 villages.
In addition, to follow up on the children from the 2015 survey of the RIECE Thailand project, we kept all children from the 94 villages in the sample (327 children, and additionally chose the children from the 2015 survey who lived in two or three of the largest villages in each of those 23 Tambons not yet included in the 94 villages drawn above. The last group comprises 299 children from 47 villages (two villages for each Tambon except one with three villages).
To sum up, the RIECE panel sample at the beginning of the 2016 survey consisted of 1,666 children aged between zero and six years old from 23 Tambobs (21 Tambons in Mahasarakham province and 2 Tambons in Kalasin province). We have followed the samples annually since 2016 until the present. See the sample size for each survey year in the table below.
Sample Size in Each Survey Year
|
Year |
Children |
Household |
|
2016 |
1,666 |
1,411 |
|
2017 |
1,510 |
1,267 |
|
2018 |
1,397 |
1,182 |
|
2019 |
1,434 |
1,230 |
|
2020 |
1,395 |
1,204 |
|
2021 |
1,324 |
1,146 |
|
2022 |
1,261 |
1,089 |
|
2023 |
1,228 |
1,065 |
|
2024 |
1,198 |
1,044 |
Note that the table includes data only for households with children.
Exposure to RIECE Thailand Experiment
Some of the samples were exposed to the RIECE Thailand experiment during 2015-2016. The experiment randomly assigned newly-graduated teachers, henceforth RIECE teachers, to co-teach in participating child development centers. Specifically, 19 (out of 50 centers) and 20 (out of 43 centers) received an additional RIECE teacher in 2015 (co-teaching in 2-3-year-old classes) and 2016 (co-teaching in 3-4-year-old classes), respectively. As a result, 998 children (out of 1,666), who attended a participating center during those years, were exposed to the experiment (both in the control and the treatment) with 526 attended centers that received an RIECE teacher in at least one year (183 in 2015 only, 187 in 2016 only, and 156 in both years), while 472 were in the control (242 in 2015 only, 38 in 2016 only, and 192 in both years). To sum up, 378, 78, and 542 were exposed only in 2015, only in 2016, and in both years, respectively.
To enable researchers to control for the potential impact of the experimental exposure, we compiled and released the “RIECE_experiment_status” dataset, which includes the “exposure2015” and “exposure2016” dummy variables indicating exposure in 2015 and 2016. In addition, the “treatment2015” and “treatment2016” identify children who attended a child development center that received an RIECE teacher in 2015 and 2016, respectively. This file is available for download from our website.
Map showing Survey Tambons
Funding
The survey has been generously and continuously supported by an anonymous Thai philanthropist and the Equitable Education Fund (EEF).